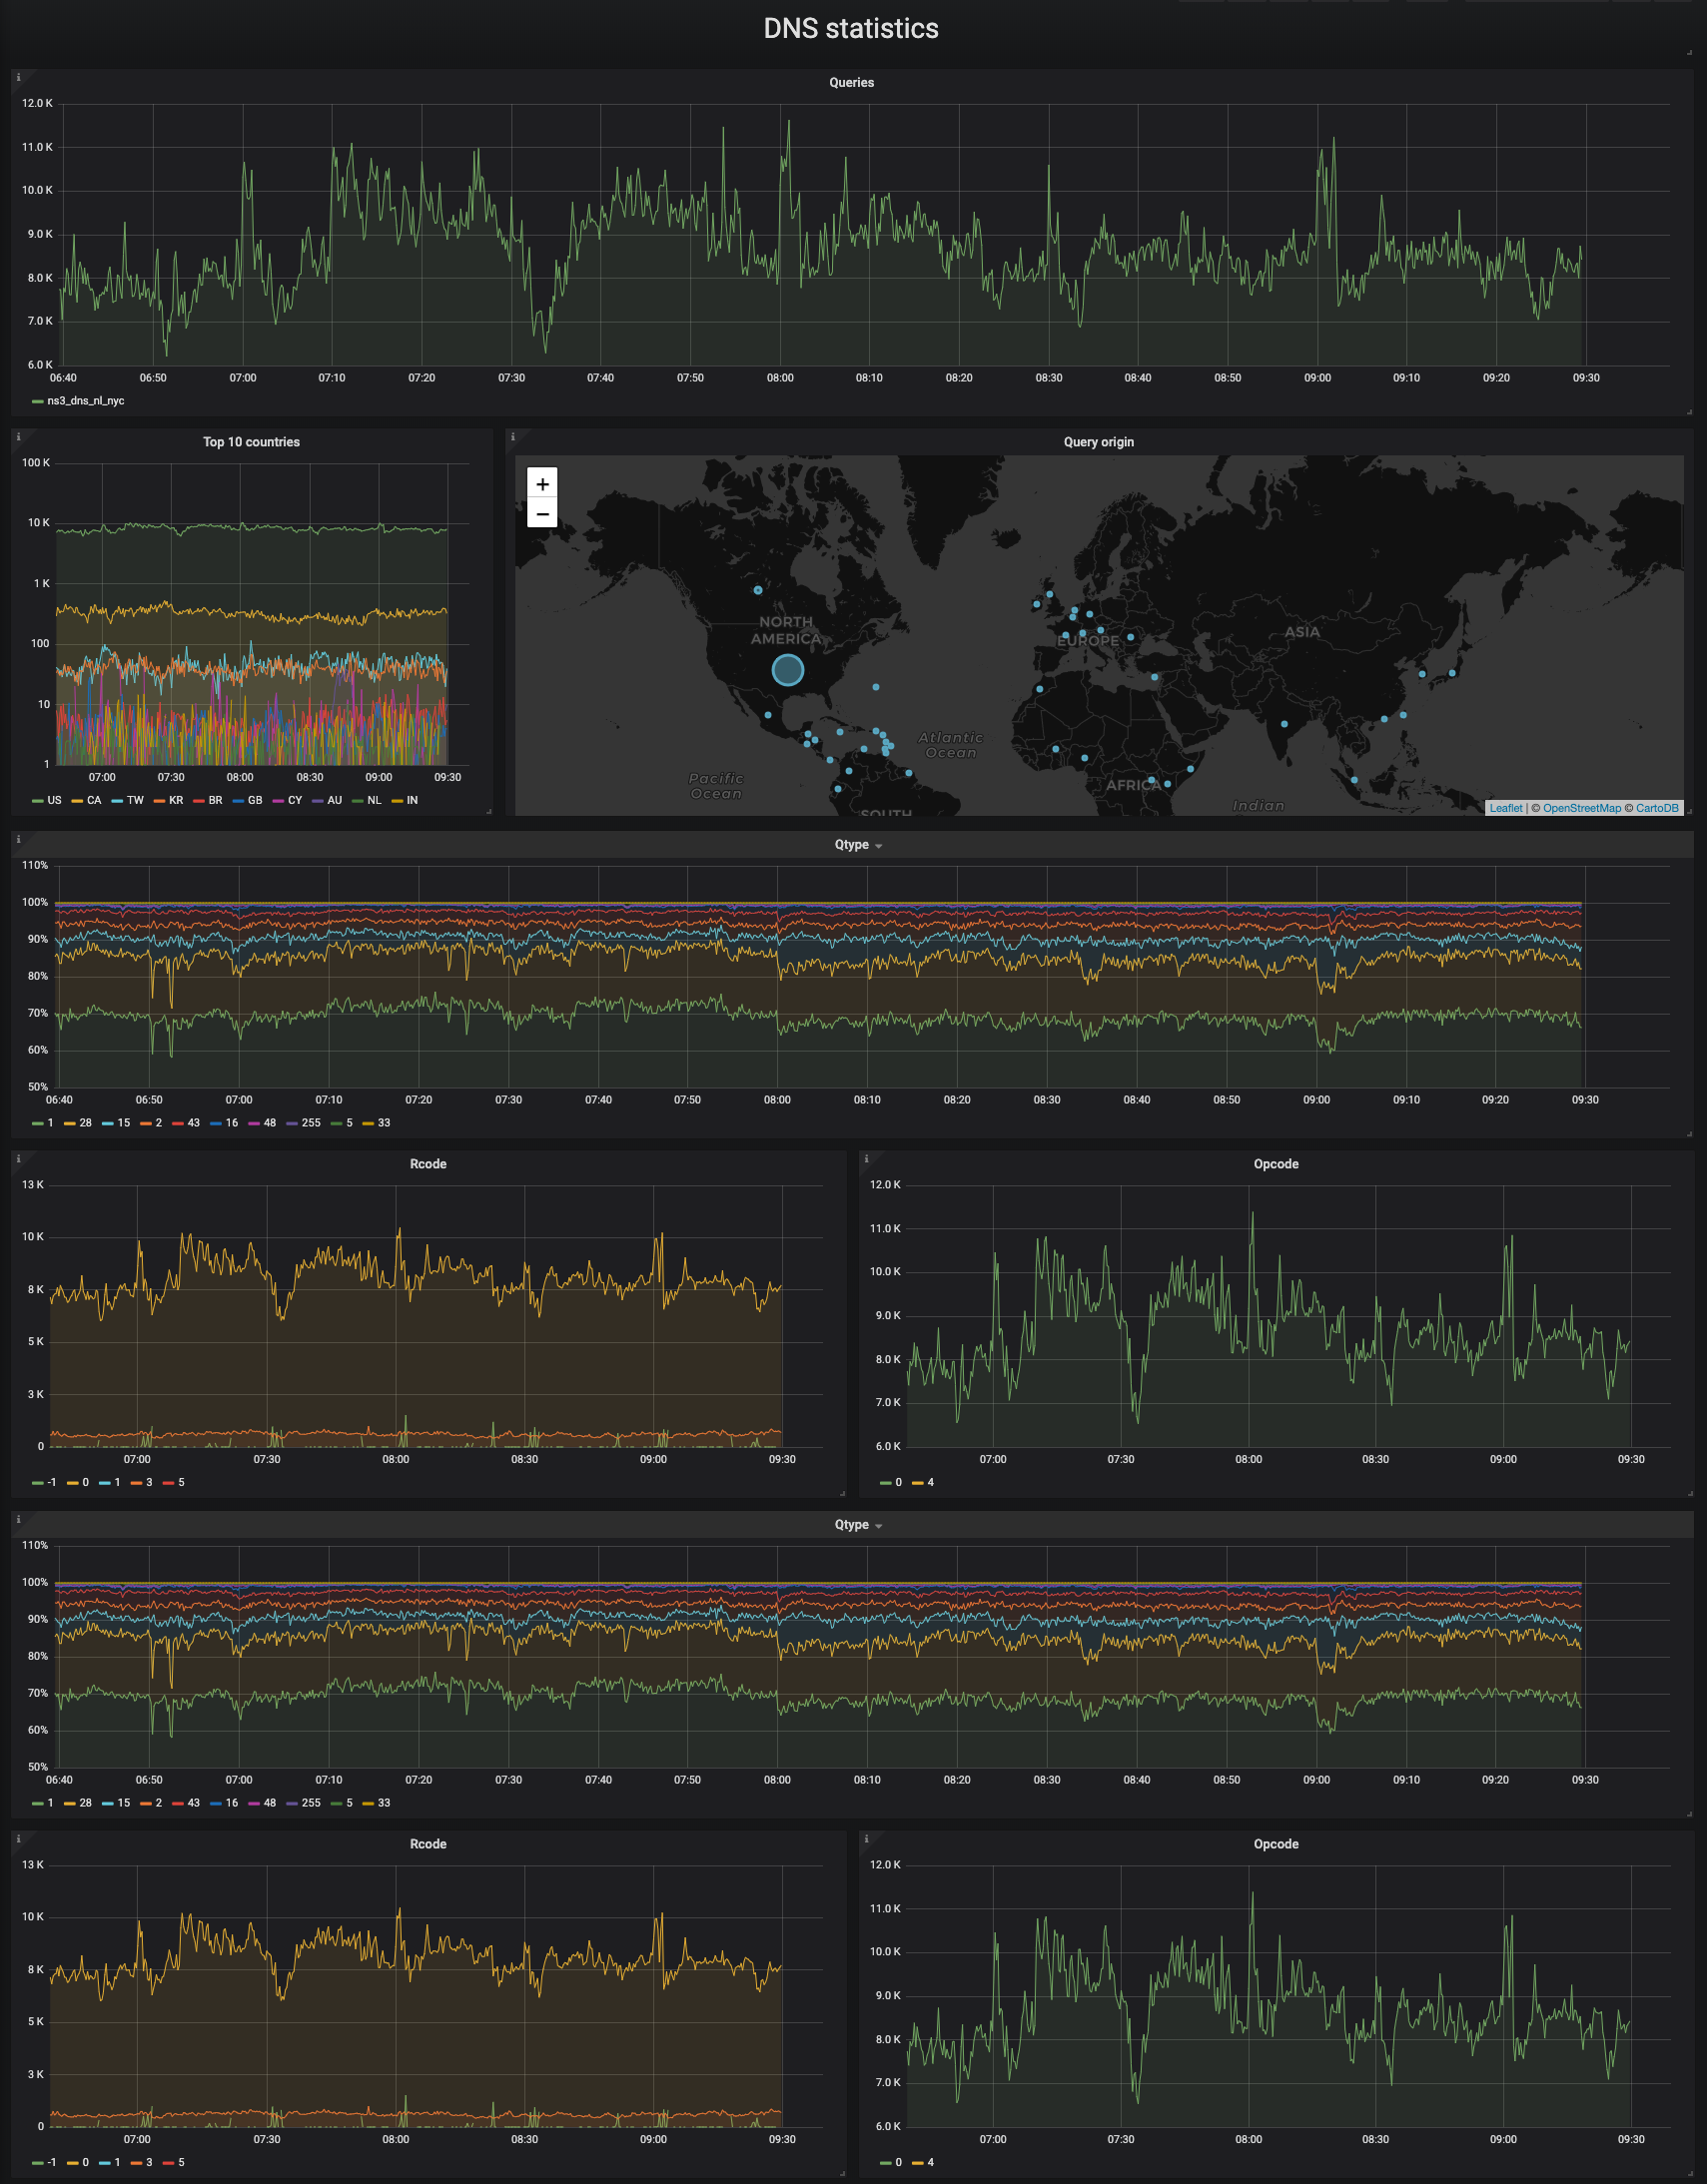
Metrics
ENTRADA sends metrics about internal processes and the processed DNS data to Graphite, for visualisation of these metrics we recommend Grafana
The ENTRADA process generates lots of metrics during the processing of DNS and ICMP data. Metrics have the form of simple key/value pairs. The key is a unique metric name and the value is a counter value. The metrics can only be sent to a Graphite monitoring server. See Graphite for more information.
By default metric values are aggregated in 10 second buckets by ENTRADA, before they are sent to Graphite.
Metrics use a naming schema which starts with a configurable prefix and is followed with the name server name. If the name server name contains any dots then these are replaced by underscores, otherwise Graphite assumes a tree structure when there is none. The following example show the dns.request metric with the prefix “entrada” and the name sever name “ns.dns.nl”.
entrada.dns.query.ns.ns_dns_nl
The dynamic prefix is configured using the Docker Composer variables, the name server name is determined by the pcap filename format.
DNS metrics
DNS metrics use the timestamp of the packet inside the pcap file, and not the timestamp of the time the packet was processed by ENTRADA.
| Metric name | Description |
|---|---|
| dns.query.ns.* | # of received queries |
| dns.response.ns* | # of received responses |
| dns.request.qtype.ns* | count per qtype |
| dns.request.rcode.ns* | count per rcode |
| dns.request.opcode.ns* | count per opcode |
Network metrics
DNS metrics use the timestamp of the packet inside the pcap file, and not the timestamp of the time the packet was processed by ENTRADA.
| Metric name | Description |
|---|---|
| tcp.ns.* | # request via TCP |
| udp.ns.* | # request via UDP |
| ip.4.ns.* | # request via IPv4 |
| ip.6.ns.* | # request via IPv6 |
| geo.country.ns.* | count per country |
RTT metrics
DNS metrics use the timestamp of the packet inside the pcap file, and not the timestamp of the time the packet was processed by ENTRADA.
| Metric name | Description |
|---|---|
| tcp.rtt.handshake.median.n.s* | # request via TCP |
| tcp.rtt.handshake.samples.ns.* | # request via UDP |
| tcp.rtt.packet.median.ns.* | # request via IPv4 |
| tcp.rtt.packet.samples.ns.* | # request via IPv6 |
Processor metrics
Processor metrics use the timestamp of the time the data was processed by ENTRADA.
| Metric name | Description |
|---|---|
| processor.execution.time | Pcap processing time per name server |
Graphite
Installation instructions for Graphite can be found here
The storage configuration of the Graphite Carbon database must be modified for the ENTRADA metrics, add to following lines to /etc/carbon/storage-schemas.conf:
[entrada_svr_metrics]
pattern = entrada.*
retentions = 10s:5d,1m:14d,10m:5y
aggregationMethod = sum

[entrada_test_metrics]
pattern = test.entrada.*
retentions = 10s:5d,1m:14d,10m:5y
aggregationMethod = sum
Grafana
Installation instructions for Graphite can be found here
Additional metrics
ENTRADA generates a set of metrics, additional metrics can be sent to Graphite by querying the database and sending the results to the Graphite server.
This example is provided by nic.lv.
#!/bin/bash

set -e
GRAPHITE_SERVER=0.0.0.0
NAMESERVER="ns1"
query4days="select count(distinct country) as countries from entrada.dns where domainname=\"example.com\" and unixtime BETWEEN unix_timestamp(now()-interval 4 days) and unix_timestamp(now()-interval 3 days);"
query3days="select count(distinct country) as countries from entrada.dns where domainname=\"example.com\" and unixtime BETWEEN unix_timestamp(now()-interval 3 days) and unix_timestamp(now()-interval 2 days);"
query2days="select count(distinct country) as countries from entrada.dns where domainname=\"example.com\" and unixtime BETWEEN unix_timestamp(now()-interval 2 days) and unix_timestamp(now()-interval 1 days);"
query1day="select count(distinct country) as countries from entrada.dns where domainname=\"example.com\" and unixtime BETWEEN unix_timestamp(now()-interval 1 days) and unix_timestamp(now());"

impala-shell -B -q "$query4days" -o output.txt
day4=$(cat output.txt)

impala-shell -B -q "$query3days" -o output.txt
day3=$(cat output.txt)

impala-shell -B -q "$query2days" -o output.txt
day2=$(cat output.txt)

impala-shell -B -q "$query1day" -o output.txt
day1=$(cat output.txt)

# this is the current timestamp, if the timestamp of the packet is needed,
# change the sql-query above to create a correct graphite line format using SQL
# see: https://graphite.readthedocs.io/en/latest/feeding-carbon.html#the-plaintext-protocol

timestamp=$(date +%s)

echo "entrada.${NAMESERVER}.countries.4daysAgo "${day4} ${timestamp} | nc ${GRAPHITE_SERVER} 2003
echo "entrada.${NAMESERVER}.countries.3daysAgo "${day3} ${timestamp} | nc ${GRAPHITE_SERVER} 2003
echo "entrada.${NAMESERVER}.countries.2daysAgo "${day2} ${timestamp} | nc ${GRAPHITE_SERVER} 2003
echo "entrada.${NAMESERVER}.countries.1dayAgo "${day1} ${timestamp} | nc ${GRAPHITE_SERVER} 2003

exit 0